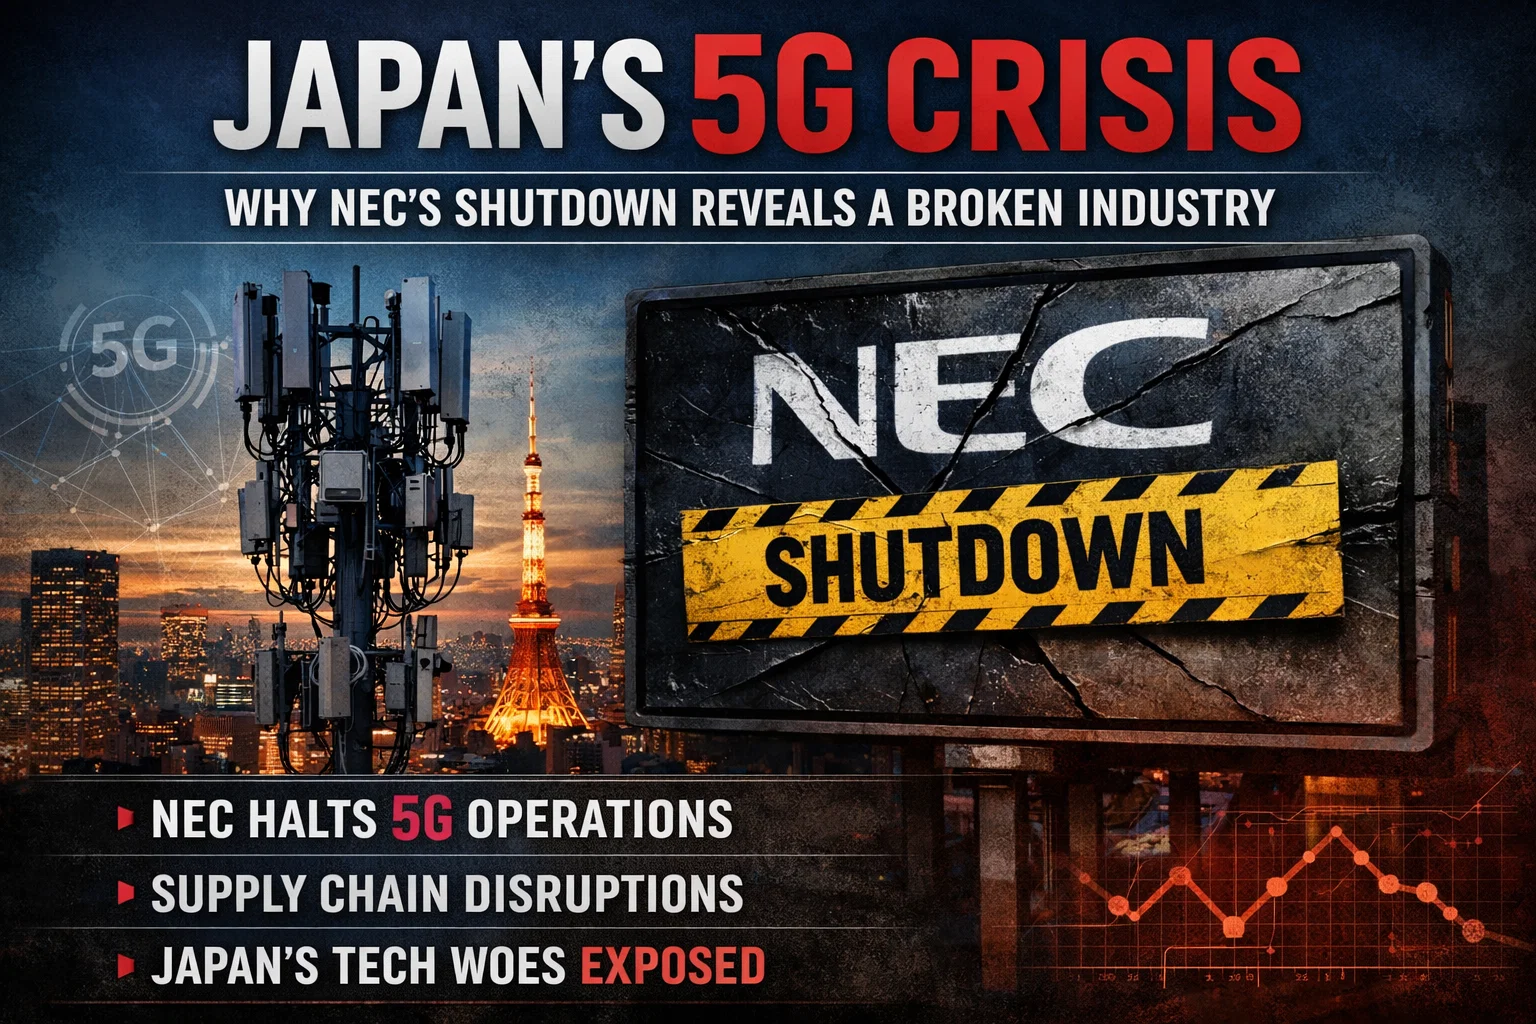
Japan 5G Crisis: Why NEC’s Shutdown Reveals a Broken Industry
Major Telecom Player Exits as Speed Records Hide Coverage Reality
Japan faces a telecommunications paradox. The country celebrates near-universal 5G coverage while watching its homegrown equipment makers retreat from the market. NEC’s recent decision to abandon 4G and 5G base station development exposes deeper structural problems that performance metrics alone can’t mask.
Speedtest data shows impressive numbers across major carriers. Yet massive gaps persist between urban centers and rural regions. This disconnect between coverage claims and on-the-ground reality tells a story of an industry struggling to balance economic viability with national infrastructure goals.
NEC Abandons Fight Against Global Giants
NEC Corporation stopped developing wireless base stations compatible with 4G and 5G standards. The company cited overwhelming market dominance by Chinese and European competitors. This retreat marks a significant moment for Japan telecommunications equipment sector.
The telecom equipment industry demands massive scale. Companies need enormous sales volumes to justify research costs, manufacturing investments, and market promotion. NEC couldn’t achieve that critical mass.
China’s Huawei Technologies, Sweden’s Ericsson, and Finland’s Nokia control nearly 80 percent of the global base station market. Japanese firms NEC and Fujitsu hold less than 2 percent combined, according to research firm Omdia. That tiny market share trapped NEC in continuous losses.
Speed Leadership Doesn’t Equal Market Success
SoftBank leads Japan speed race. The carrier recorded median download speeds of 62.05 Mbps across all network types during Q3 2025. KDDI’s au network followed at 57.85 Mbps, according to Ookla’s Speedtest Intelligence data.
Rakuten Mobile posted the fastest 5G-specific performance. Its median 5G download speed hit 128.39 Mbps with upload speeds of 22.34 Mbps. SoftBank came close with 127.45 Mbps downloads and 17.51 Mbps uploads.
These impressive figures don’t tell the complete story. Speed means little if users can’t access 5G networks consistently.
Coverage Numbers Hide Massive Access Gaps
Government data shows 5G population coverage reached 98.4 percent by the end of fiscal year 2024. That statistic suggests universal service. Real-world availability tells a different tale.
NTT DOCOMO achieved the highest 5G availability score at 38.4 percent. This metric tracks how often users with 5G-capable devices actually connect to 5G networks. KDDI’s au network trailed by over six percentage points. SoftBank recorded the lowest 5G availability at 26.5 percent, despite delivering the fastest overall speeds.
The gap between coverage and availability reveals a critical issue. Operators prioritize 5G deployment in dense urban areas with high demand. They rely on 4G networks to serve the rest of the country, particularly harder-to-reach regions.
Geography Creates a Digital Divide
Japan population concentrates heavily in cities. Over 92 percent of residents live in urban areas. Yet spectrum licenses require operators to provide service across all 47 prefectures, including rural and mountainous terrain.
Prefecture-level data exposes dramatic disparities. Osaka recorded the highest 5G availability at 35.2 percent. Yamanashi ranked lowest at 9.1 percent. Users in Yamanashi connect to 5G almost four times less frequently than users in Osaka, according to Ookla’s analysis.
Economic activity drives these differences. Osaka, Tokyo, Aichi, and Kanagawa show strong 5G availability, reflecting concentrated deployment in profitable markets. Inland and mountainous prefectures like Yamanashi and Nagano record much lower access due to deployment costs and sparse population density.
Speed and Access Don’t Always Align
Higher 5G availability typically correlates with faster speeds. Osaka combined 35.2 percent availability with median 5G downloads of 172 Mbps. Tokyo recorded 33.7 percent availability and 128 Mbps median speeds.
Exceptions break this pattern. Yamagata posted Japan fastest median 5G speed at 181 Mbps despite low availability of only 13.9 percent. This suggests infrastructure exists to meet coverage requirements, but low user density prevents network congestion and enables higher speeds.
Lower Performance Reveals Quality Issues
The 10th percentile metric shows how networks perform for the slowest users. This measurement matters because it reveals the experience for those struggling with poor connections.
NTT DOCOMO generally posted stronger results at the lower end. The carrier recorded the highest or near-highest minimum speeds in many prefectures, including 41 Mbps in Ishikawa. SoftBank achieved the single highest result at 49 Mbps in Aomori, but performance varied wildly. Minimum speeds dropped to 4 Mbps in Nagano and 6 Mbps in Chiba.
KDDI’s au and Rakuten Mobile showed lower but more consistent minimum speeds. This points to fewer dramatic drops but less overall capacity.
Japan 6G Gamble May Not Pay Off
NEC plans to continue development for 6G wireless standards despite exiting 4G and 5G. This strategy mirrors Japan broader push to leapfrog current-generation technology.
Japan launched the Beyond 5G Promotion Strategy in 2020. The roadmap targets establishing key technologies by 2025 and deploying Beyond 5G services by 2030. Industry experts question this approach.
Insufficient 5G development may hamper 6G progress. Ultra-high-frequency 6G spectrums travel in straight lines over very short distances. This requires much denser base station deployment than 5G. Japan inadequate 5G infrastructure creates a weak foundation.
Patent data reveals technology gaps. Japan 6G patent applications account for just 9.9 percent of the global total, according to a survey by Nikkei and Cyber Creative Institute.
Political Alliances Won’t Solve Industrial Problems
Japan recently hosted a closed-door meeting of the Global Coalition on Telecommunications (GCOT). Participants included Australia, Canada, the UK, and the US. The group focuses on next-generation 6G standards and artificial intelligence cooperation.
Media outlets interpret GCOT as an effort to counter China’s telecommunications influence. This approach faces significant challenges.
Geopolitical considerations divide the global market. Fragmentation increases technology development costs and reduces network interoperability. The 4G and 5G eras demonstrated that successful technologies emerge from widespread market demand, open cooperation, and extensive market testing.
Japan telecom equipment industry faces fundamental industrial constraints. The country lacks a large, unified internal market to incubate technologies and achieve economies of scale. Political partnerships cannot compensate for these structural disadvantages.
Market Saturation Shifts Competition Focus
Japan mobile market reached saturation years ago. The country had around 194 million cellular connections in early 2025, representing a 157 percent penetration rate. Operators compete on service quality and network access rather than subscriber growth.
All major carriers maintain 4G availability above 97 percent. This shows LTE remains central to nationwide service delivery. The consistency of 4G contrasts sharply with variable 5G access.
SoftBank’s network strategy illustrates the speed-versus-coverage trade-off. The carrier delivers the fastest overall speeds but provides the lowest 5G availability. This suggests concentrated investment in high-traffic areas at the expense of broader 5G deployment.
Consistency Gaps Persist Across Regions
Ookla’s 5G consistency score measures network reliability for activities like video streaming. Prefectures with higher median speeds typically show better consistency. SoftBank recorded the highest consistency scores in many regions, particularly in Hokkaido and Tōhoku.
NTT DOCOMO and KDDI’s au network also demonstrated steady performance. This reflects the benefits of established infrastructure and ongoing network upgrades.
Rural and geographically challenging areas posted lower consistency scores. Parts of northern Kanto struggled with reliable 5G connections, even where coverage technically exists.
What This Means for Japan Tech Future
Japan achieved its stated goal of near-universal 5G population coverage. Government mandates and sustained carrier investment made that possible. However, performance data reveals persistent quality and access disparities based on location.
NEC’s withdrawal from base station development signals that market forces ultimately determine industry participation. Without sufficient scale, even national champions cannot sustain operations in highly competitive global markets.
The country’s 6G strategy represents a high-stakes bet. Success requires overcoming current infrastructure limitations and closing substantial technology gaps. Political coalitions may provide diplomatic cover, but they cannot substitute for market competitiveness and technical expertise.
Closing Japan urban-rural 5G divide demands continued, targeted investment in harder-to-serve regions. Without that commitment, uneven network experiences will persist despite impressive national coverage statistics.
Frequently Asked Questions
Why did NEC stop making 5G equipment despite Japan strong mobile network?
NEC couldn’t compete with global giants controlling 80 percent of the base station market. The company held less than 2 percent global market share, making it impossible to achieve the economies of scale needed to cover development costs. High capital requirements and intense competition from Huawei, Ericsson, and Nokia forced NEC to exit the 4G and 5G equipment market, though it continues pursuing 6G technology development.
How does Japan 5G availability differ from its coverage statistics?
Japan reports 98.4 percent 5G population coverage, but actual availability tells a different story. 5G availability measures how often users with capable devices actually connect to 5G networks. Even the best carrier, NTT DOCOMO, achieves only 38.4 percent availability. SoftBank drops to 26.5 percent despite having the fastest speeds. This means users spend most of their time on 4G networks, even in areas with technical 5G coverage.
What causes the huge differences in 5G access between Japanese prefectures?
Economic and geographic factors create dramatic regional disparities. Osaka leads at 35.2 percent 5G availability while Yamanashi falls to 9.1 percent. Operators concentrate 5G investment in dense urban areas with high revenue potential. Rural and mountainous regions face higher deployment costs with fewer subscribers to justify the expense. This business logic creates a growing digital divide between urban centers and rural communities.
Can Japan successfully leapfrog to 6G technology without strong 5G infrastructure?
Industry experts express significant doubt about this strategy. Japan Beyond 5G Promotion Strategy aims for 6G deployment by 2030, but the country holds only 9.9 percent of global 6G patents. More critically, 6G requires much denser base station networks than 5G due to ultra-high-frequency spectrum limitations. Japan inadequate 5G infrastructure creates a weak foundation for 6G advancement, suggesting the leapfrog approach faces serious technical and economic challenges.